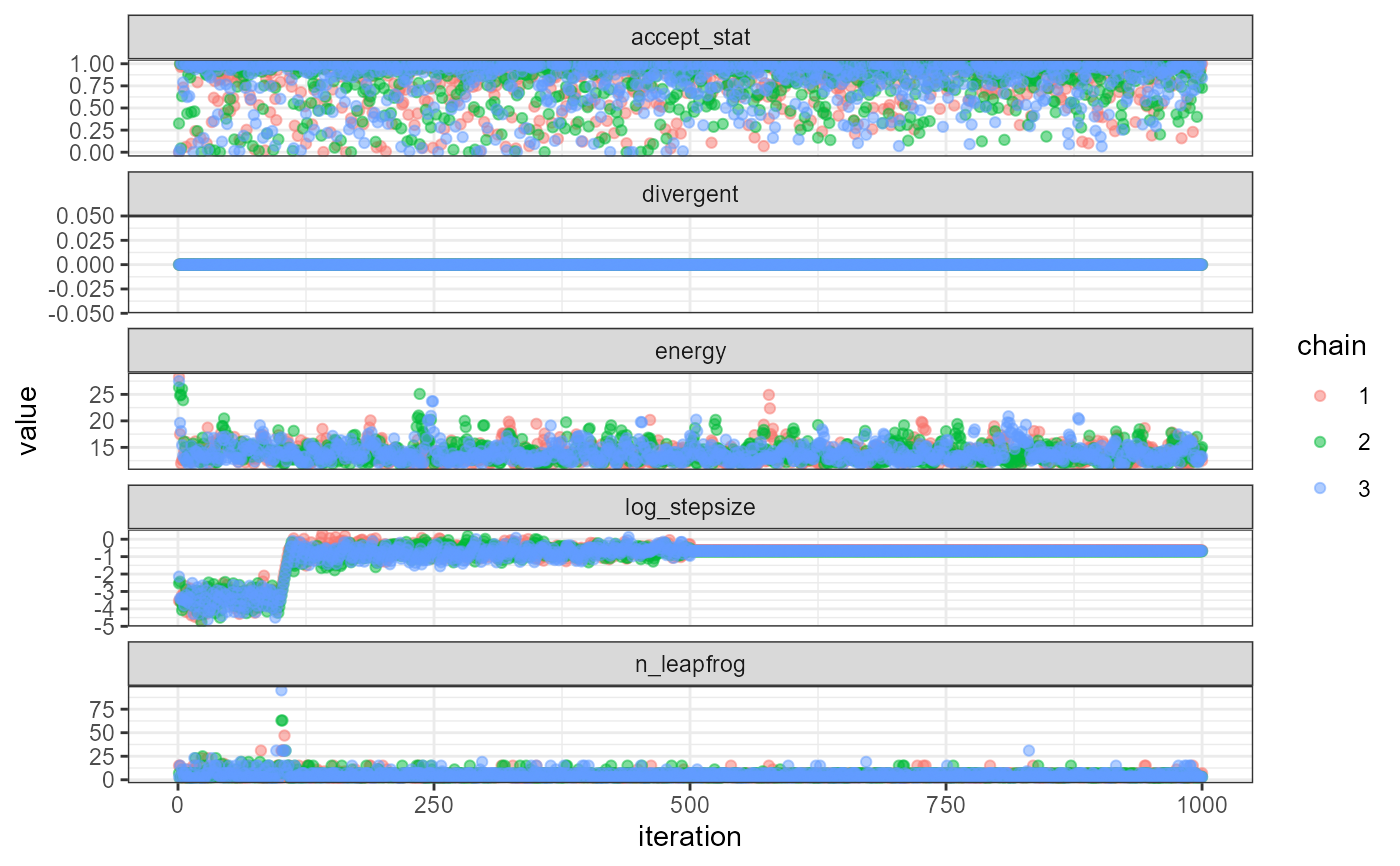
Plot adaptation metrics for a fitted model.
Arguments
- fit
A fitted object returned by
sample_admb.- plot
Whether to plot the results
Examples
fit <- readRDS(system.file('examples', 'fit.RDS', package='adnuts'))
plot_sampler_params(fit)

Plot adaptation metrics for a fitted model.
A fitted object returned by
sample_admb.
Whether to plot the results
fit <- readRDS(system.file('examples', 'fit.RDS', package='adnuts'))
plot_sampler_params(fit)
